Online WHIPPET User Guide
Table of contents: Introduction, Steps, Adjust WHIPPET Run Settings, Calflora Saved Searches, Adjust Population Variables, Run WHIPPET!, Acknowledgments, Additional Information, Appendix A: Generating Custom GIS Scoring Data
Introduction
WHIPPET is the Weed Heuristics: Invasive Population Prioritization for Eradication Tool. It prioritizes weed infestations for eradication based on potential impact, potential spread, and feasibility of control. WHIPPET may help land managers identify a high-priority population of an otherwise lower-priority species, and, conversely, exclude a low-priority population of a high-priority species. This will enhance manager efficiency and provide greater ecological protection. It was originally developed to prioritize populations of California's A-rated noxious weeds at a regional (multi-county) scale (Skurka Darin 2008, Skurka Darin et al. 2011). The original version of WHIPPET required a user to research information on the impacts and spread of each species and score those species based on the WHIPPET criteria. It also required access to ArcGIS software. The California Invasive Plant Council has developed this online version of WHIPPET to make the tool accessible to more users. This version takes advantage of web-based GIS and existing databases of information like the Cal-IPC Inventory. (More customization is possible with the desktop version; contact Gina Darin for more information.)
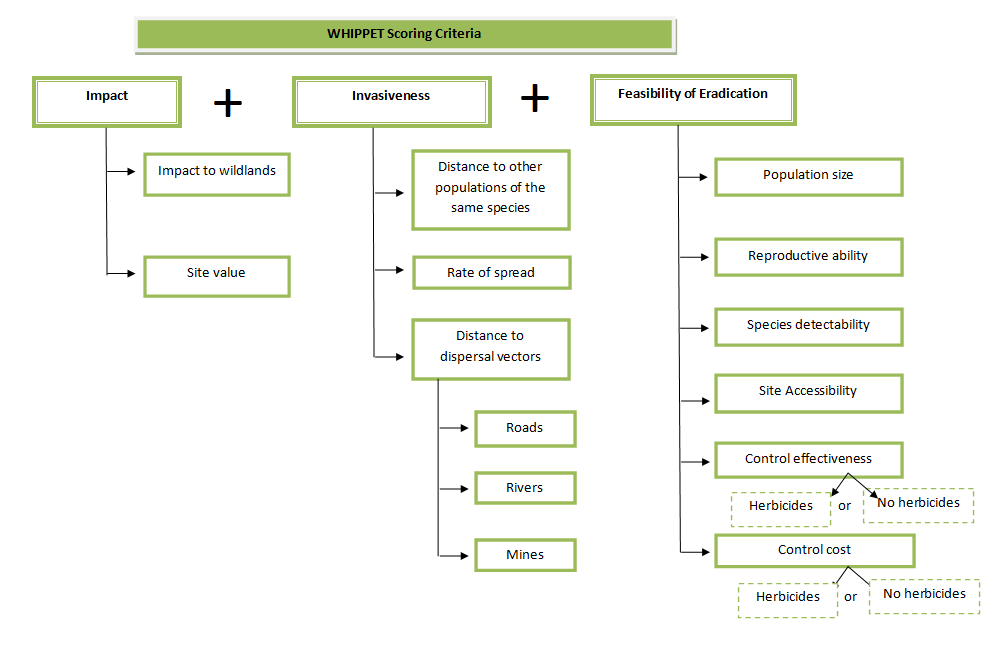
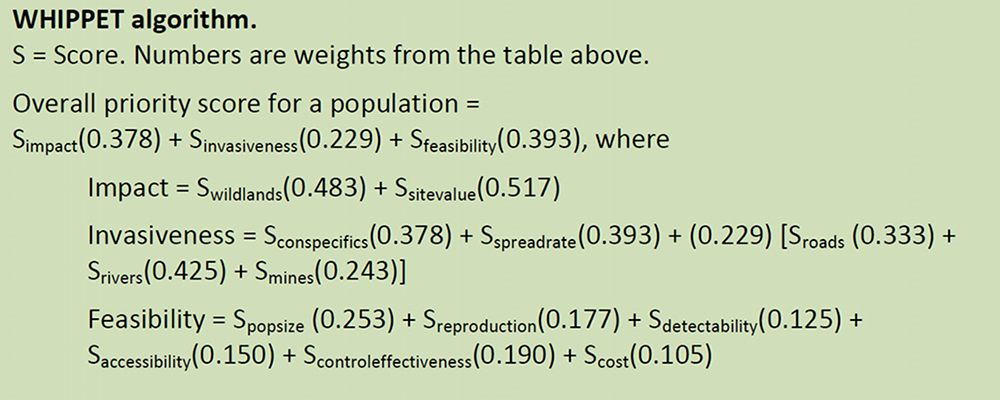
WHIPPET provides results in the form of a ranked list of populations, with rankings based on species and population data. It is based on a set of weighted criteria in three categories (see diagram below). Online WHIPPET draws from a species database with information on 200 invasive plants in California. WHIPPET emphasizes cost-effective eradication of risky populations; therefore, small populations, outliers, and species that are easy to control receive higher scores than large populations, abundant species, or species whose biology makes them difficult to control. For population locations, online WHIPPET relies on data from the Calflora database (www.calflora.org). At this time, WHIPPET contains information only for the plants on the California Invasive Plant Council Inventory ( www.cal-ipc.org/paf). In the future, with additional funding, we hope to build in the ability for users to include information on additional species.
Questions on WHIPPET? Please contact mapping@cal-ipc.org or read these Frequently Asked Questions.
DisclaimerWHIPPET online is for California only (for now). If you're working near the state border, be aware that it will not capture populations on the other side. You may want to consider that in your own post-processing.
You may have factors in your project area that are not included in the WHIPPET calculations. You need to look at the WHIPPET results and decide if they make sense. WHIPPET offers suggestions, but is not a prescription.
Steps
Getting Ready to Use WHIPPET
Online WHIPPET pulls data on population locations and population size from Calflora. Users can base their prioritization on data already in Calflora, can upload their own data to Calflora, or can use a combination of the two. You will need a Calflora Contributor account in order to use WHIPPET; register for an account at http://www.calflora.org/entry/mycalflora.html. To upload data from a GIS shapefile or spreadsheet, use http://www.calflora.org/entry/upload.html. Users can choose to make uploaded data public (viewable to anyone) or private (viewable only to that user). Private data can be used in WHIPPET only by the user who uploaded it. It is important to consider up front which species and populations you want to include in your prioritization. The results from WHIPPET will only be as good as the data that are used!
Adjust WHIPPET Run Settings
Select whether to use public data from Calflora, unpublished data from your own Calflora account, or both. You must load data into Calflora before using WHIPPET; data cannot be entered into WHIPPET directly. Unpublished data must be in the same account you are using to log into WHIPPET. Be aware that data from Calflora may no longer be accurate.
Select species
Choose species from the drop-down list. This list includes species from the Cal-IPC Invasive Plant Inventory. Use Control to select each species.
Area of Interest
Selecting an area can be done in four ways: selecting a county, drawing a shape on the map, using the entire area visible on the screen, or uploading a shapefile. An uploaded layer must be a shapefile in polygon or multi-polygon geometry. Polygons will be simplified to half-mile accuracy. If your area has a complex shape or multiple polygons, you may want to select the entire area by drawing a shape rather than uploading a file. We suggest selecting an area or using a shapefile that is slightly larger than your boundaries to ensure that populations on the edge of your site will be included.
Custom GIS Data
This step is optional. The Site Value sub-score and the Roads sub-score are populated with default values. The Roads score is calculated based on the distance from the population to the nearest public road. The Site Value is taken from the California Department of Fish and Wildlife's Areas of Conservation Emphasis (ACE II). You may want to create a custom Roads layer to include forest or park roads, trails, or levees that are not part of a standard ESRI roads layer. You may want to create a custom Site Value layer based on your priorities, such as locations of sensitive species. Instructions for creating customized layers are in Appendix A: Generating Custom GIS Scoring Data.
Calflora Saved Searches
Using a Saved Search from Calflora can save time for running multiple WHIPPET runs on a particular combination of species and location.
- Create a Saved Search in Calfora with multiple species:
- Go to Calflora.org, log in to your account, and click "My Calflora" on the left column.
- Click "Plant lists" from the menu bar across the top. Click "New List" and fill in the form fields, including adding multiple plant species. The search must include Cal-IPC Inventory species to be used by WHIPPET. Click "Save."
- From that same Plant List Definition page, run a search for your plant list by clicking the "Observation Hotline Search" link in the middle of the page.
- From the Observation Hotline page, create a polygon of your WHIPPET project area by clicking the "DRAW A POLYGON" dropdown in the middle of the page and follow those instructions. Click "Search."
- Copy the URL from the address bar. Click the Calflora homepage link in the upper left corner, click "My Calflora," and then click "Searches." Click "Add another search," give it a name, indicate the use as "WHIPPET" (very important, otherwise WHIPPET won’t recognize the saved search), and paste your copied URL into the "Search URL" field. Click "Save."
- Bring up a saved search in WHIPPET Online:
- In the WHIPPET Run Settings box, click "Load a Calflora Search" and choose your saved search from the options in the dropdown list.
- For help with Calflora Saved Searches, contact Calflora at spprt@calflora.org.
Adjust Population Variables
"Get Records" will display a table of populations matching your selected species and area. Clicking on the row for a population will highlight it yellow and highlight the corresponding population on the map. Click on a population on the map to jump to that row of the table. Values in the table come from Calflora, are calculated based on the location, or are default values that can be adjustable. (See Additional Information for detailed descriptions of each score.)
- Select Populations to Remove from Analysis WHIPPET will analyze all populations of the selected species in the selected area. Uncheck the box on the right of a row to remove that population. Removing a population means that it will not be part of any calculations. This might be chosen if a user knows that a population listed in Calflora no longer exists. The most important calculation this will influence is the distance to conspecific populations. We recommend including all populations in analysis and adjusting the population list in the final spreadsheet of WHIPPET results.
- Adjust Site Value Site Value indicates the importance of this location from the perspective of wildlife conservation and is based on the California Department of Fish and Wildlife's Areas of Conservation Emphasis. Adjust these settings if you know particular areas that are more important to protect. Note: If you uploaded custom Site Values, this step may be skipped.
- Adjust Accessibility Accessibility refers to how difficult it is to reach a population to treat it. This is a subjective score with a default value of 3 (Moderate). Users can adjust scores based on their knowledge of each location.
- Adjust Population Size Population size is based on data from Calflora. However, very few Calflora records contain this information so most populations will show a default value of >1-10ac (3). Adding values for population size when uploading your own data to Calflora will greatly increase the value of your WHIPPET results. For other populations, adjust the approximate population size where known.
- Select whether herbicides are an option This selection asks whether chemical control is a possible option for management. Selecting “yes” does not mean that herbicides will be used, only that they could be used. The selection will apply to all populations and influences the scores for Control Effectiveness and Control Cost. We singled out chemical control from other methods because some agencies or locations do not allow the use of herbicides.
Run WHIPPET!
Results are available in two formats: a spreadsheet with the scores and geographic coordinates for each population and a map. Save these files to your computer for future reference. You may save your session and return to it, or run multiple sessions with adjustments in the scores in order to compare the differences of adjusting particular parameters.
Interpret ResultsThe results from your WHIPPET session provide a provisional prioritization based on current objective data at hand. This prioritization should next be reviewed by informed reviewers and collaborators who can inspect the rankings and the information they are based on. The prioritization may be modified based on factors not included expressly in the model, or the WHIPPE T session itself may be modified and run again with adjusted parameters. For transparency and future understanding, changes and their justification should be documented.
The overall priority score for a given population is as objective as possible and provides insight into why a given population was or was not a high priority for eradication. Look at the major criteria scores (Impact, Invasiveness, Feasibility) for further insight. The actual priority score is not as meaningful as its rank relative to the other targeted populations. Some clustering of populations of the same species will occur because the species-level criteria contribute considerable weight to the overall priority score.
Note: If you are relying on Calflora records that are not your own, widespread species may rank artificially high in the results. This will happen because many widespread species (such as annual grasses) are underreported and therefore will show up as isolated populations when they are not.
The pdf map created by WHIPPET is intended as a broad overview. Each priority level on the map represents 25% of the range of total scores. Geographic coordinates in the spreadsheet can be imported into GIS software to create more detailed maps for field crews. If you do not own ArcGIS software, you may want to look into free GIS options for creating maps such as ArcGIS Explorer or Quantum GIS
Here are suggested steps to take with the results:
- Assess your available budget
- Estimate your cost for controlling the highest priority populations. Consider employing Weedsearch™, an online tool developed in Australia, to help estimate costs (http://www-personal.une.edu.au/~ocacho/weedsearch.htm.)
- Choose projects with a commitment to follow through to eradication
- For populations and species that fall just under the borderline, it may be important to focus monitoring to make sure information is accurate and their status is not changing.
- Consider sites that may not be highly ranked, but are in close proximity to or en-route to high-priority sites, thus maximizing staff and resource efficiency.
- Consider populations of other species not included in the analysis, i.e. species not on the Cal-IPC Inventory.
- Consider connections between populations, such as which are upstream or downstream.
Appendix A: Generating Custom GIS Scoring Data
The Site Value sub-score and the Roads and Trails sub-score are calculated from default values, but you may have local information that is more accurate (e.g. your own site valuation) and better vectors of dispersal layers (e.g. your own roads and trails). This step is optional and is intended for advanced users with GIS capability.
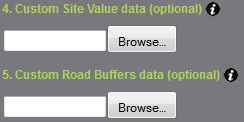
To provide your own local scoring, use the Custom Site Value data and Custom Roads/ Trails data options to upload shapefiles. These shapefiles must be formatted as follows:
- Uploaded in a ZIP file, containing four components of the shapefile: SHP, SHX, DBF, PRJ.
- The shapefiles must be POLYGON or MULTIPART POLYGON geometry.
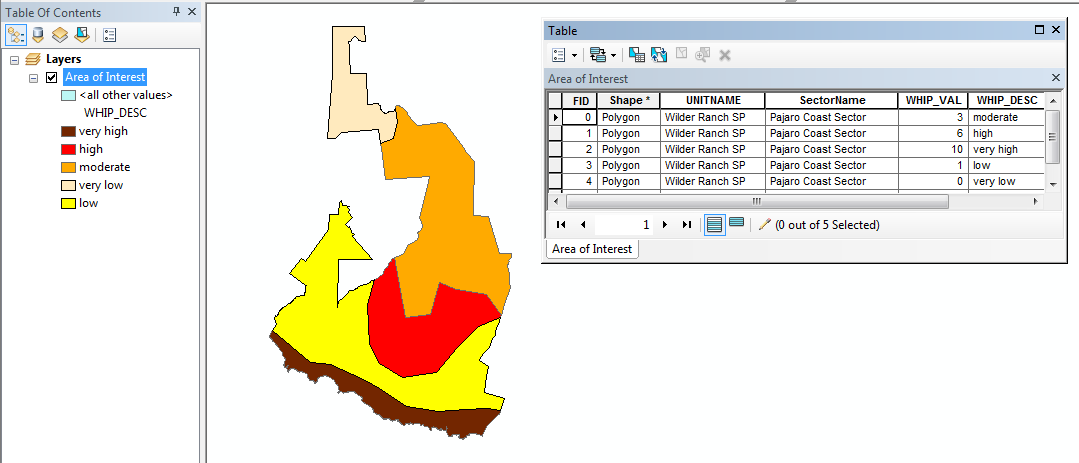
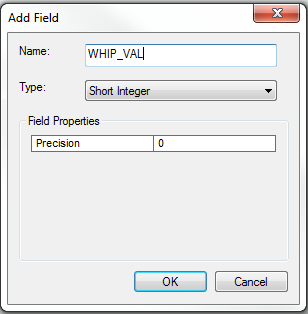
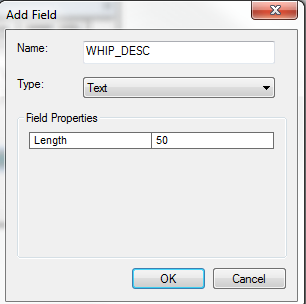
- Each polygon must have an attribute named "WHIP_VAL" (a.k.a. WHIPPET VALUE shortened to comply with ESRI shapefile naming rules). This score must be one of the WHIPPET integer values: 0, 1, 3, 6, 10. A 10 indicates the highest site value or the shortest distance to a road, while a 0 or 1 indicate very poor site value or farthest distance. We also ask that you include a WHIP_DESC that is a text field, so as to help you to check yourself to know that you have accurately coded your WHIPPET values.
- A polygon not meeting these criteria will be rejected.
Custom Site Value
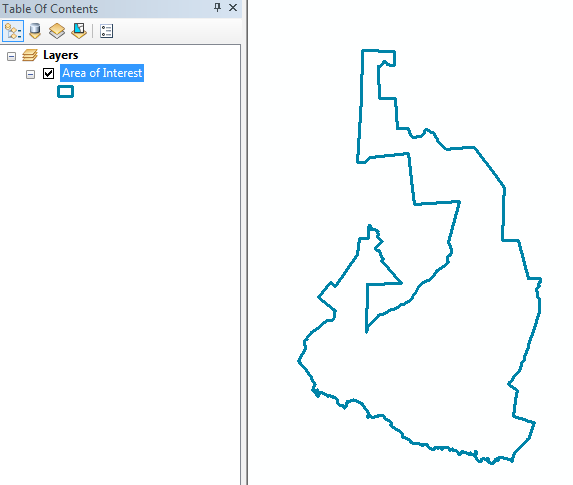
Your Custom Site Value layer will replace the default Site Value for all areas that you score. Any areas left blank will be scored with the default Site Value. This step-by-step example demonstrates the generation of Custom Site Value data, using ArcMap. It is important to use the Editor toolbar’s Cut Polygon Tool on your Area of Interest shapefile, so that you avoid any gaps or slivers of no data within the polygon.
-
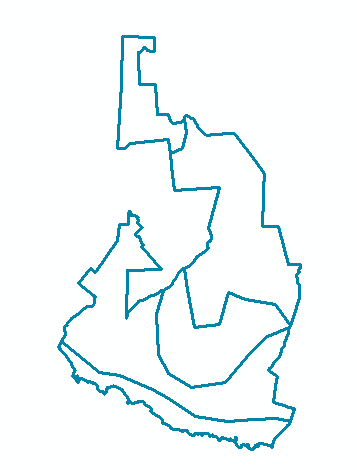
Combine and dissolve your area of interest into one polygon or a multipart polygon. Go to Editor / Start Editing and specify your Area of Interest as the polygon to be edited. (This example uses Wilder State Park in Santa Cruz.)
-
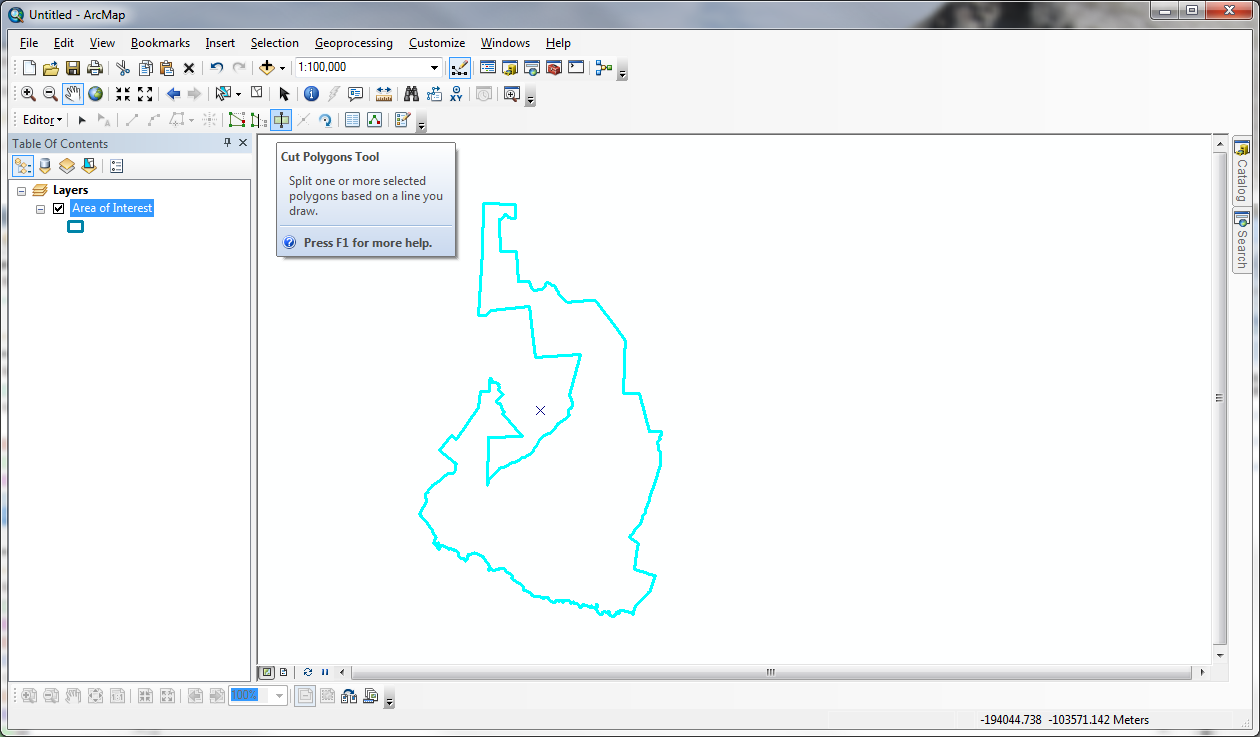
Select your polygon Turn on the Editing Toolbar – Start Editing, and grab the Cut Polygon Tool in the Tools toolbar.
-
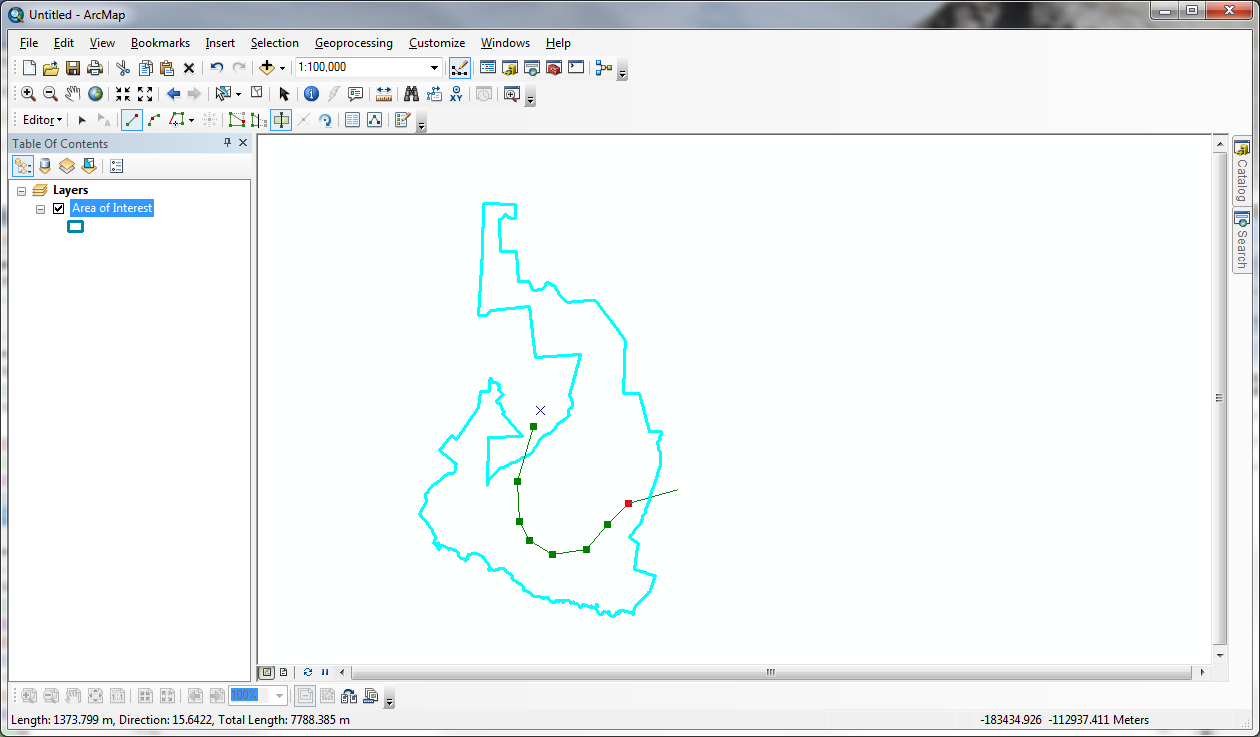
Start outside the polygon and end with a double click outside the other side of the polygon, making whatever vertices you’d like along the way:
-
Repeat this step until you have generated all of your areas with differing Site Values.
-
Next, bring up the Attribute Table, and add a new field named WHIP_VAL. This is an integer field.

-
I also add a field called WHIP_DESC to be used as a self-check, to verify that I am describing the WHIPPET values correctly. This is a text field and is an accountability step.

-
Turn on your Editing Toolbar, Start Editing, then double-click inside the WHIP_VAL and WHIP_DESC cells to assign both a score and description to the buffered areas.
- Choose Editor / Stop Editing.
- Rename file: Go into ArcCatalog and delete files you don’t need and rename this layer to CustomSiteValue.
- Create a ZIP file containing the four required shapefile components: SHP, SHX, DBF, and PRJ. If you include other components such as the SBN and XML files, they will be ignored. For this step, you may need to install third-party software such as 7zip or WinZip.
- Examine your shapefile before uploading it to WHIPPET to identify gaps.
Custom Roads/Trails
This next step-by-step example demonstrates the generation of Custom Roads/TrailsBuffers data polygons, using ArcMap's Multiple Ring Buffer tool. In this hypothetical scenario, I place a very high value on areas that are close to roads or trails which are likely dispersal vectors. This custom layer will replace the default roads layer for the area you define. Be sure to include all roads, trails, levees, or other linear terrestrial features you want WHIPPET to include. Your custom layer must include major highways and other public roads if you want them analyzed.
-
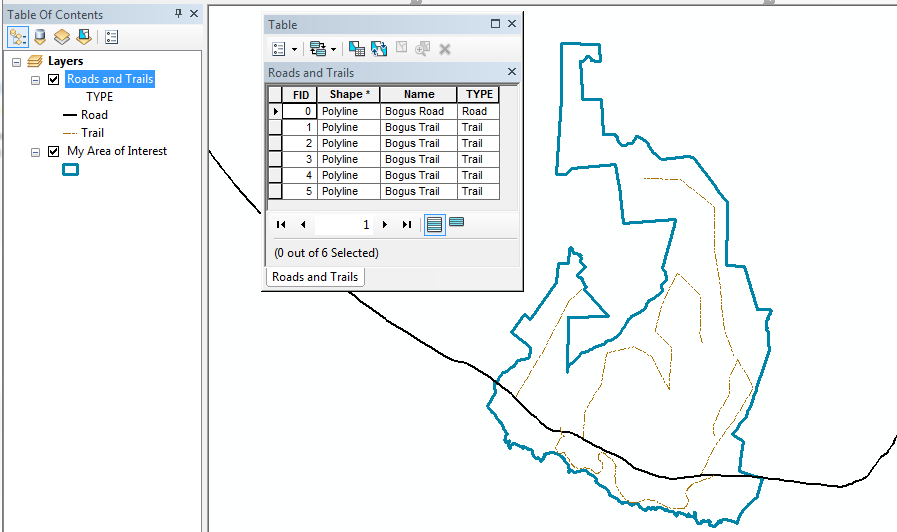
Combine all the roads and trails data in the area of interest into one shapefile and load this combined file into ArcMap.
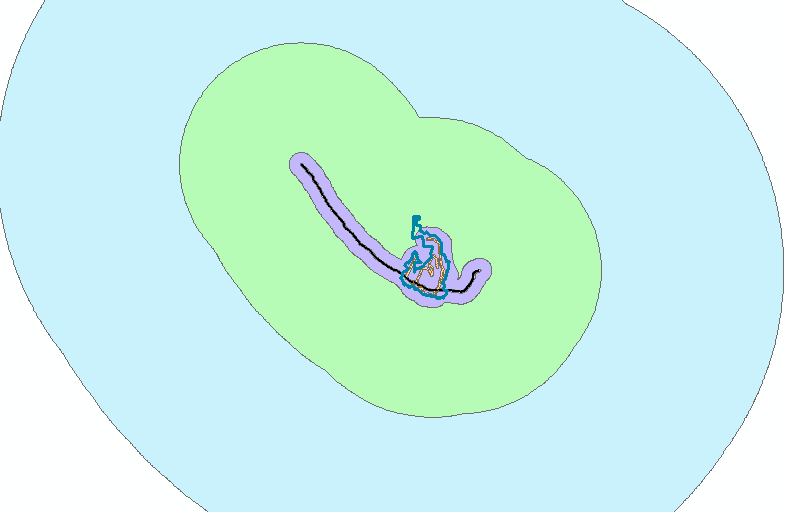
- Bring up the Toolbox / Analysis Tools / Proximity / Multiple Ring Buffer. Enter the size of your buffers (10, 100, 1000, 10,000), the Buffer Unit: Meters and Dissolve Option: ALL. (You can choose different distances. WHIPPET results will be based on the assigned scores.)
-
This results in a set of polygons, with overlapping areas all dissolved and cleaned up:
- his next step-
Open the Attribute Table, and add a new field named WHIP_VAL. This is an integer field.
-
Add a text field called WHIP_DESC to help ensure that you have described the WHIPPET values correctly.
-
Turn on your Editing Toolbar. Start Editing, then double-click inside the WHIP_VAL and WHIP_DESC cells to assign both a score and description to the buffered areas.
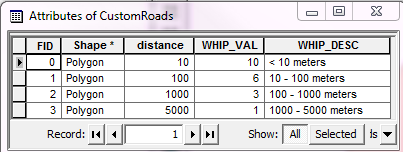
Note that the 0 value above will be assigned to areas with NO DATA or >10,000 meters from roads/trails. - Choose Editor / Stop Editing.
- Rename file: Go into ArcCatalog and delete files you don’t need and rename this layer to CustomRoads.
- Create a ZIP file containing the four required shapefile components: SHP, SHX, DBF, and PRJ. If you include other components such as the SBN and XML files, they will be ignored. For this step, you may need to install third-party software such as 7zip or WinZip.
-
Your ZIPped shapefile is now ready to upload as Custom Site Value or Custom Road/Trails data:
References
- The Calflora Database. www.calflora.org
- Cal-IPC. 2006 and updates. California Invasive Plant Inventory. California Invasive Plant Council, Berkeley, CA. www.cal-ipc.org/paf
- Skurka Darin GM (2008) Prioritizing Weed Populations for Eradication at a Regional Level: the California Department of Food and Agriculture's A-rated weeds. M.S. thesis. University of California, Davis http://www.cdfa.ca.gov/plant/ipc/weeds/pdf/prioritizing_weed_populations.pdf
- Skurka Darin GM, Schoenig S, Barney JN, Panetta FD, DiTomaso JM (2011) WHIPPET: a novel tool for prioritizing invasive plant populations for regional eradication. Journal of Environmental Management 92(1):131-139
Acknowledgments
This user guide was adapted from G. Darin's user manual for the original version of WHIPPET. The development of the original version of WHIPPET was supported by USDA Forest Service, National Science Foundation, University of California-Davis Department of Plant Sciences, California Department of Food and Agriculture, and California Department of Water Resources. Funding was provided by the USDA Forest Service, Special Technology Development Program; California Landscape Conservation Cooperative; and US Fish and Wildlife Service Inventory and Monitoring Program. A generous ESRI Conservation Grant supports WHIPPET, as well as Cal-IPC’s statewide data collection and suitable range modeling effort.
In accordance with Federal law and US Department of Agriculture policy, Cal-IPC is prohibited from discriminating on the basis of race, color, national origin, sex, age, or disability. (Not all prohibited bases apply to all programs.)
To file a complaint of discrimination, write USDA, Director, Office of Civil Rights, Room 326-W, Whitten Building, 1400 Independence Avenue, SW, Washington, DC 20250-9419 or call (202) 720-5964 (voice and TDD). USDA is an equal opportunity provider and employer.
Additional Information
WHIPPET was envisioned by Steve Schoenig while at the California Department of Food and Agriculture (CDFA Integrated Pest Control Branch) in the early 2000s and developed with funding from the US Forest Service's State and Private Forestry Grant by Gina Darin while completing her Master's research at UC Davis from 2006-2008. CDFA needed a systematic tool to help prioritize A-rated weed infestations for eradication by considering characteristics of the target species, as well as their specific locations. Gina Darin's Master's thesis tested WHIPPET's ability to prioritize individual infestations for eradication separately, recognizing that not all infestations of a given weed pose the same threats and feasibility of eradication. The test of the prioritization tool using a sample of CDFA's A-rated weeds showed that by considering spatial, logistical, and biological aspects of individual populations within a species, some populations ranked significantly higher than others in the resulting prioritization due to the combinations of being located in a concentration of rare species occurrences, nearby a vector of spread, and easily accessible.
Criteria DefinitionsWhippet Criteria Scores and Weights
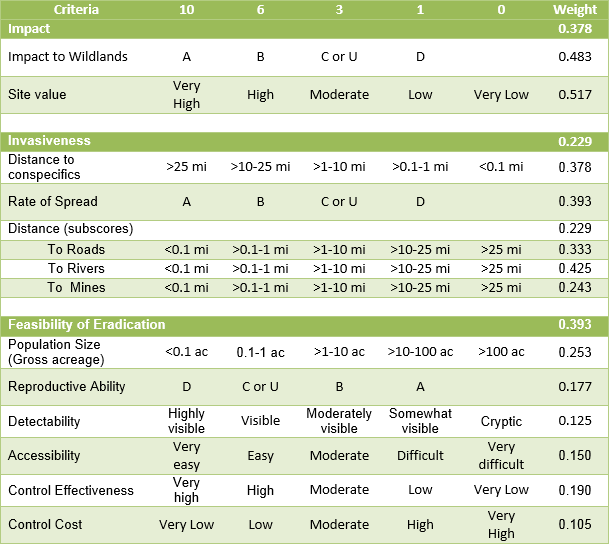
Impact:
- Impact to Wildlands – Based on Cal-IPC Inventory, Section 1 (Impacts).
- Site Value – Based on California Department of Fish and Wildlife's Areas of Conservation Emphasis (ACE II), which incorporates species diversity, species rarity, and sensitive habitats into a statewide grid of 2.5 square mile hexagons. We used their ecoregional model.
- Distance to Conspecifics - Based on nearest population of the same species. Minimum distance between populations is 10m.
- Rate of Spread – Based on Cal-IPC Inventory, Section 2 (Invasiveness).
- Distance to Dispersal Vectors (Population scores) – Distance to major vectors for spread of invasive plants. Scored based on the closest vector to that population.
- Roads – Based on ESRI roads data. Includes local as well as major roads. Does not include some nonpublic roads such as on National Forests. Does not include most trails.
- Rivers – Based on National Hydrology Database from the US Geological Survey, 1:24,000 scale.
- Mines - Based on locations of active mines from the Office of Mine Reclamation, California Department of Conservation.
Feasibility of Eradication:
Population Size – Calflora database or entered by user.
Reproductive Ability – Based on Cal-IPC Invasive Plant Inventory, question 2.4.
Detectability – Relative difficulty of seeing a plant of this species. Based on expert knowledge.
Accessibility – Relative difficulty of reaching population. Entered by user. Default is Moderate (3).
Control Effectiveness – Relative effectiveness of control for this species. This score was divided into two options depending on whether a user indicates that chemical control is a management option. Choosing “yes” for chemical control means that it is an option but does not necessarily mean it will be used.
Control Cost – Relative cost of controlling a species. Scored based on expert knowledge and information from DiTomaso et al. 2013 Weed Control in Natural Areas of the Western United States.